
Objective
- Maximize the number of annual memberships by converting casual riders to annual members
- Understand how casual riders and annual members use Cyclistic bikes differently
Key Stakeholders
- Lily Moreno: Cyclistic's director of marketing and manager
- Cyclistic Marketing Analytics Team: A team of data analysts who are responsible for collecting, analyzing, and reporting data that helps guide Cyclistic marketing strategy
- Cyclistic Executive Team: Will decide whether to approve the recommended marketing program
Data Limitations
- Approximately 13.60% of the data for start_station_name / start_station_id and 14.70% of the data for end_station_name / end_station_id for July 2022 are missing, resulting in incomplete data for those 4 columns.
- Data is also too large to load into an Excel file or SQL database normally.
Presentation

1 of 17
Youtube
- How do annual members and casual riders use Cyclistic bikes differently?
- Why would casual riders buy Cyclistic annual memberships?
- How can Cyclistic use digital media to influence casual riders to become members?
- How long do each rider use bikes, organized by rideable type (and casual / member), over the past year on a weekly and monthly basis?
- How has the percentage of casual-to-members changed over the past year?
- Create a folder “Bicycle Dataset” that will contain all the relevant excel files for this case study.
- Download each 2022 csv files from Index of bucket "divvy-tripdata" and place them in the csv subfolder.
- Appropriately name each CSV file based on the “Month_Year_Riders_Data” format.
- Convert each file into xlxs file and place them in the appropriate folder.
- The dataset was provided by Google through the Index of bucket "divvy-tripdata" website.The data itself has been made available by Motivate International Inc. under this license.
- Personal data regarding each user has been removed.
- The time period for the data takes place from July 2021 to July 2022.
- Replace all blank cells for each file with “N/A”.
- Remove all duplicate rows for each file.
- Clean each file by trimming each column. Format date columns properly. Convert data types for each column into text, numbers, or date-time.
- Convert each dataset into a table.
- If the start time is greater than the end time, then flip the cell values with each other. Find the ride length of each user.
- Find the day of week for each row in each file using the column name “day_of_week” where 1 = Sunday and 7 = Saturday.
- Remove columns I to N
- Analyze what percentage of riders are casual riders and annual members.
- What type of rideable types are most popular for casual riders, annual members, and all members.
- What is the average ride length, maximum ride length, and most common day of the week?
- What is the average ride length for casual riders and annual members?
- What is the average ride length for each user by day of the week and number of rides for users by day of the week.
- Use r to import the dataset from multiple excel files and group them under 1 single table. Open packages tidyverse, readxl, and tidyr
- bicycle_fol_path "C:/Users/mmamu/OneDrive/Desktop/Bicycle Dataset/Monthly Ridership Data XLSX File" will store 13 Excel files associated with different months of the year under the variable bicycle_fol_path.
- bicycle_data_frame dir(bicycle_fol_path, full.names = TRUE) %>% map_df(read_excel) is used to import each excel file and combine them as a single table. The table is then assigned to the bicycle_data_frame variable.
- saveRDS(bicycle_data_frame, "main_riders_data.rds") is used to save the bicycle_data_frame variable as a RDS file with the name “main_riders_data.rds”. This is done so that the dataset does not get removed when closing RStudios.
- install.packages("Hmisc") is used to install the Hmisc library, which contains many functions useful for data analysis.
- library(Hmisc) will load the library for us to use.
- describe(main_riders_data) will be used to note the number of rows, missing values, distinct values, frequency, proportion, lowest, and highest of each column.
- summary(main_riders_data) will be used to provide summary statistics for each column.
- main_riders_data %>% group_by(rideable_type) %>% summarise(median_day_of_week = median(day_of_week), avg_day_of_week = mean(day_of_week), mode_day_of_week = Mode(day_of_week)) is used to find the mean, median, and mode of each day of the week grouped by rideable type.
- main_riders_data %>% group_by(rideable_type) %>% summarise(median_ride_length = median(ride_length), avg_ride_length = mean(ride_length)) is used to find the mean and median ride length grouped by rideable type.
- main_riders_data %>% group_by(day_of_week) %>% summarise(median_ride_length = median(ride_length), avg_ride_length = mean(ride_length)) is used to find the average and median ride length by week day.
- The median and average day of the week that classic, docked, and electric bikes are used is Wednesday. The mode is Saturday.
- The median ride length for classic, docked, and electric bikes are 00 : 11 : 31, 00 : 28 : 05, and 00 : 10 : 02, respectively. The average ride length are 00 : 19 : 30, 01 : 28 : 14, and 00 : 14 : 52, respectively. Docked bikes have the longest ride length of any rideable type.
- The median ride length during the weekend is about 13.50 minutes, while the median ride length during the weekday is about 10.50 minutes. The average ride length during the weekend is about 25 minutes, while the average ride length during the weekday is about 18 minutes.
- Casual and annual members, on average, like to ride on Wednesdays.
- The median and average ride length for casual members are longer than that of annual members.
- Count the number of casual riders and annual members on a monthly basis, then create a month by month comparison using a line chart.
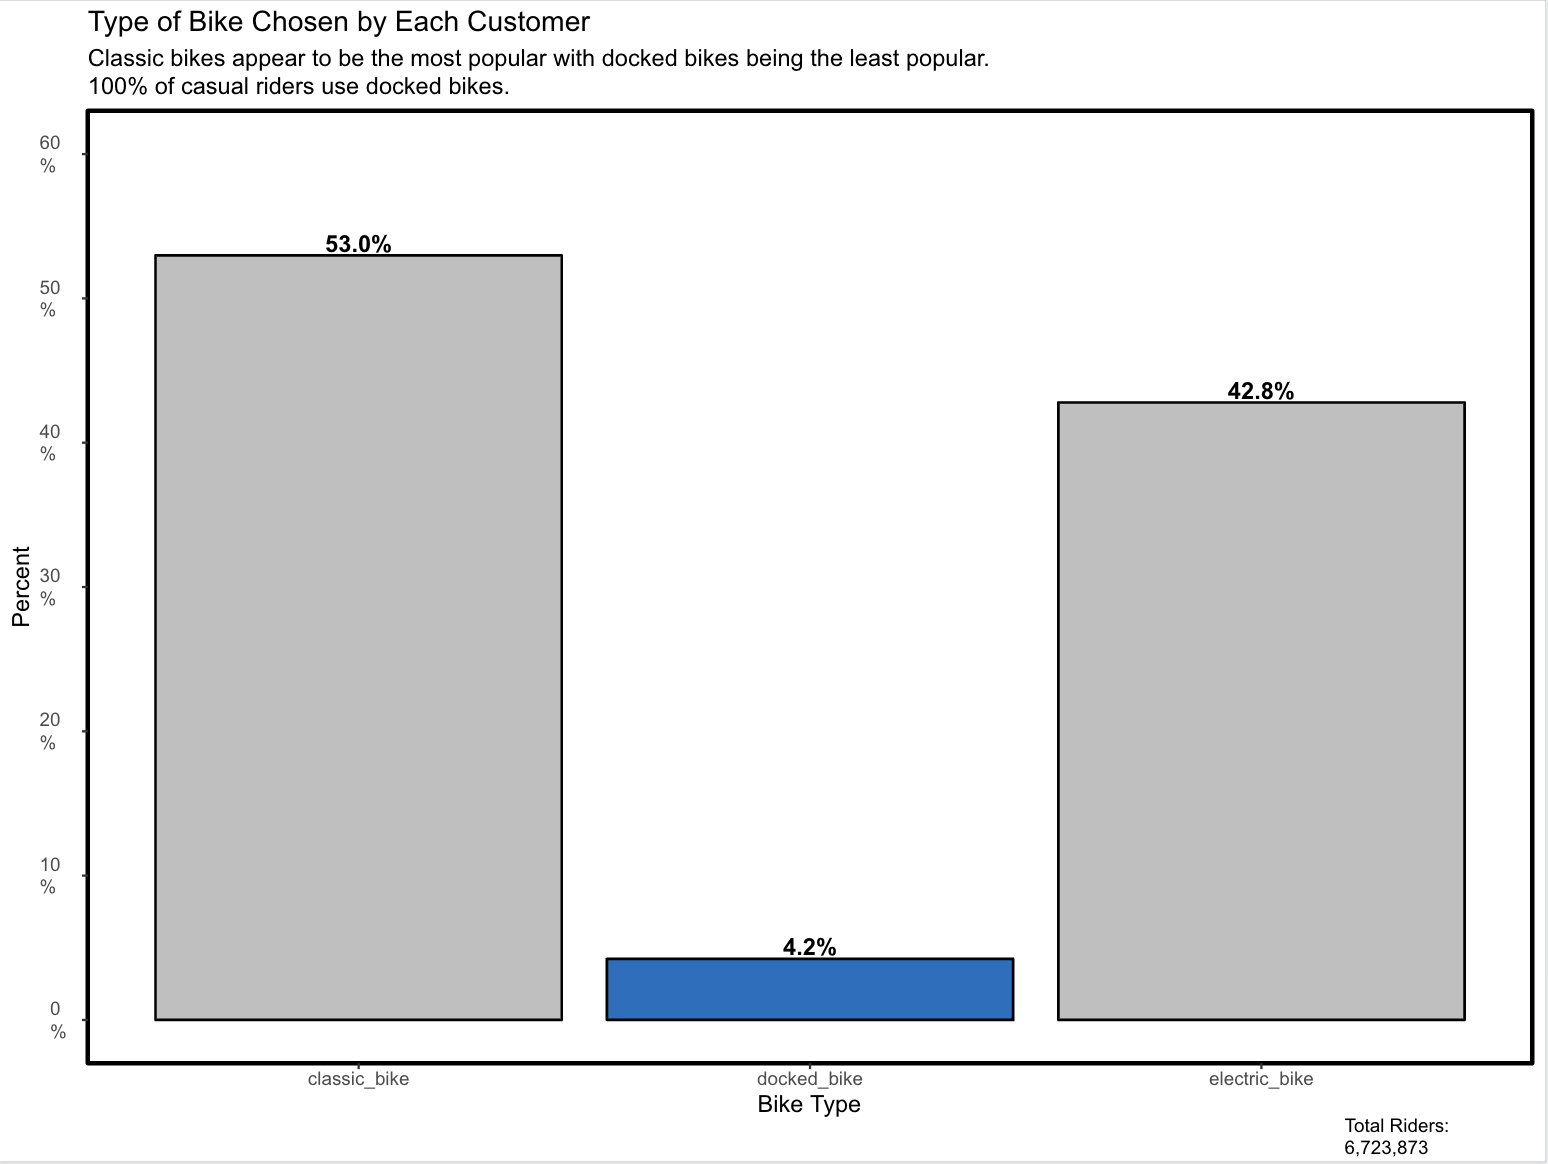
- rideable_type_all_chart chart is a bar chart that shows the percentage of total riders who use classic, docked, and electric bikes.
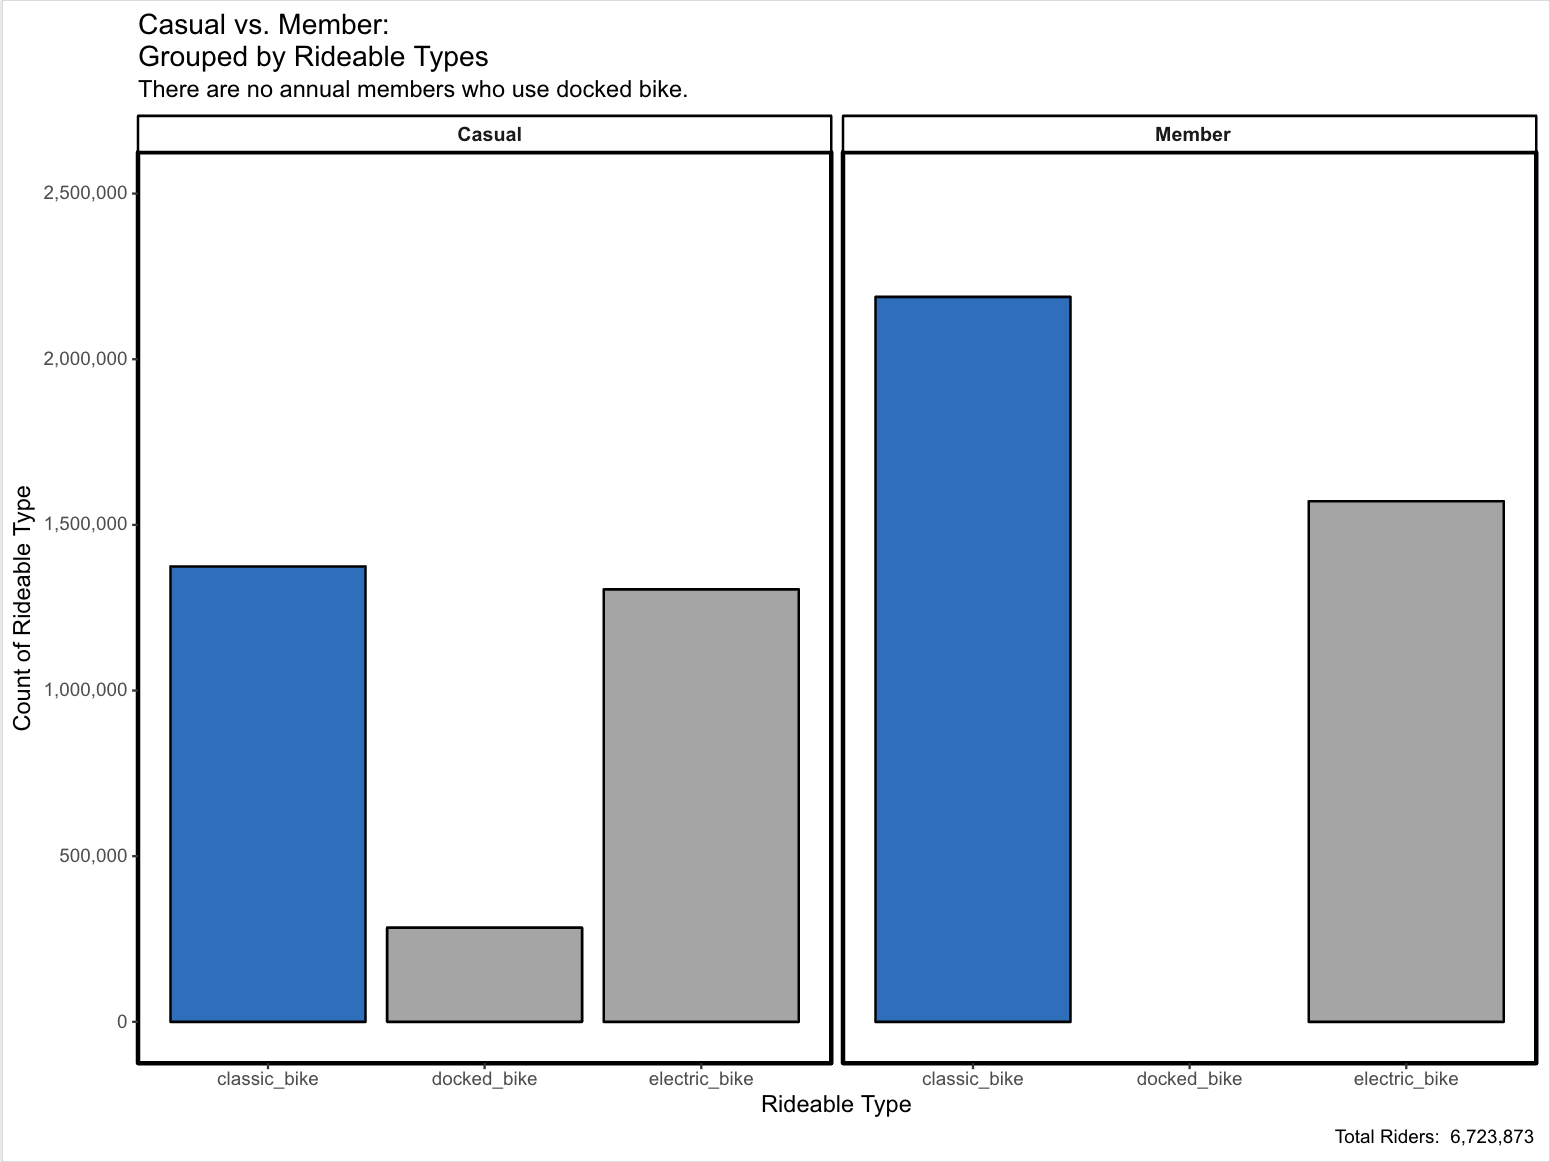
- member_casual_rideable_type_grouped_chart are bar charts that show the breakdown of rideable bikes between annual members and casual riders.
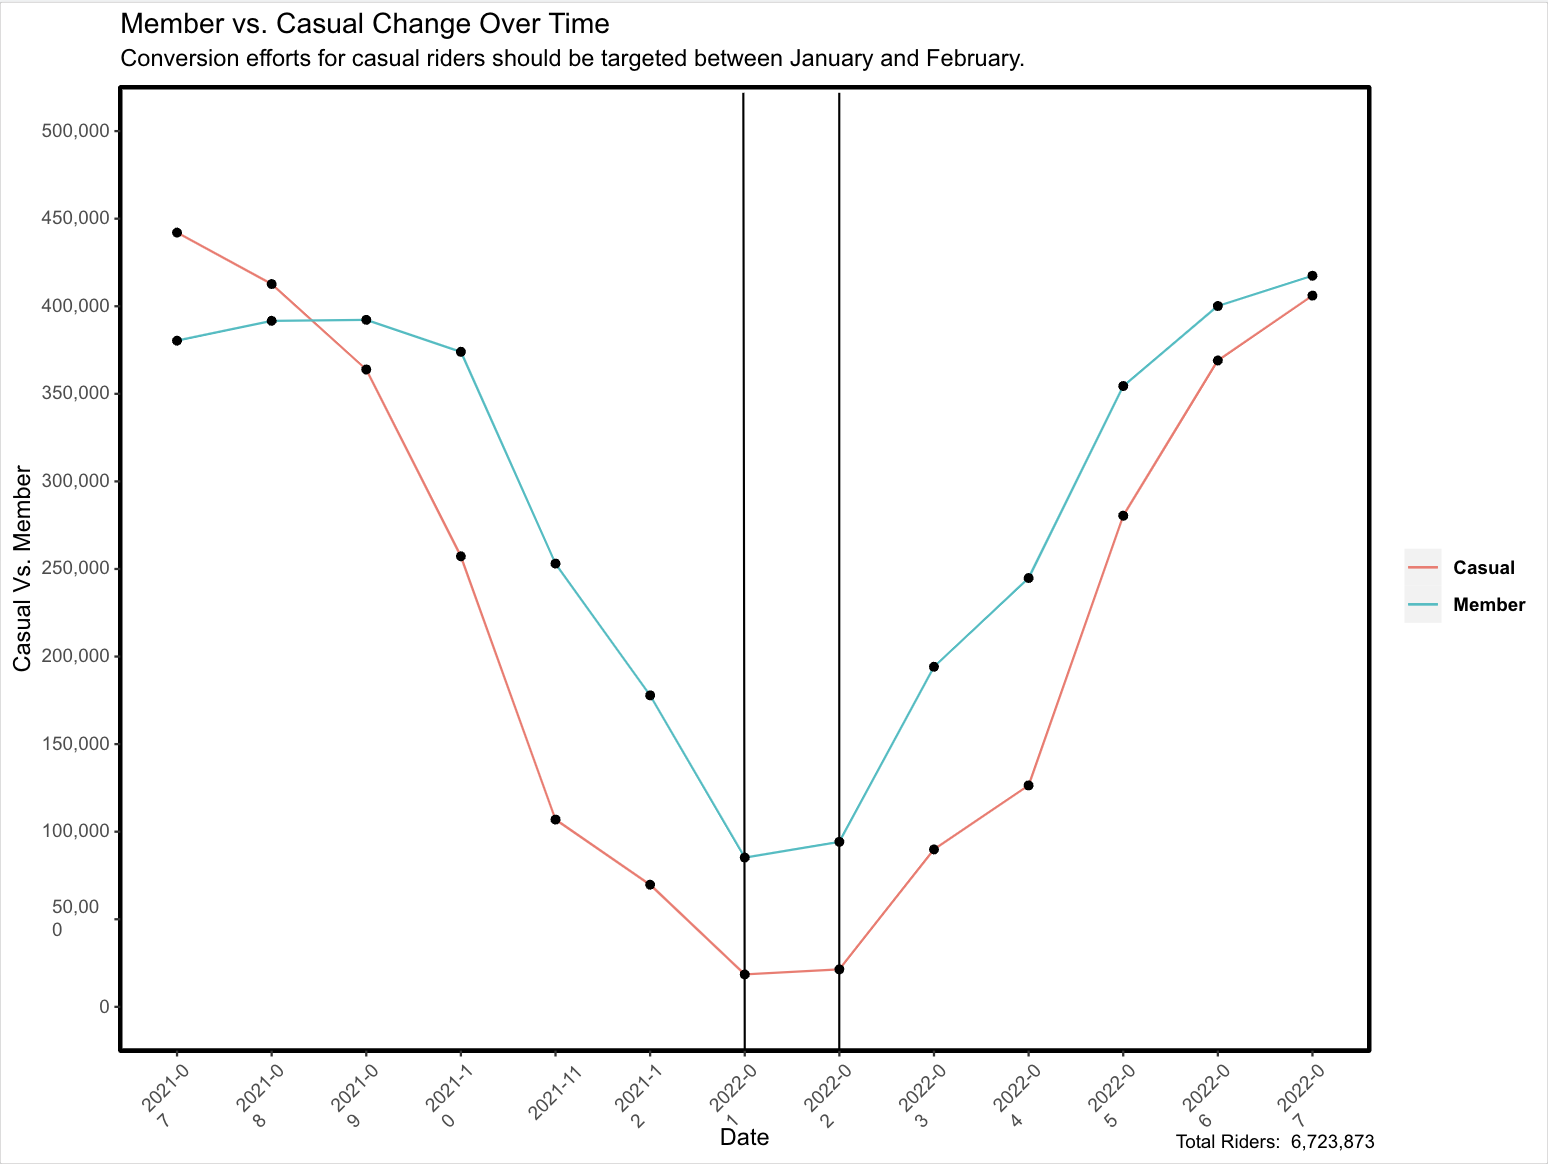
- member_vs_casual_absolute_numbers is a line chart used to show the number of annual members and casual members on a monthly basis over a 1 year timeframe.
- member_vs_casual_stacked_bar is a stacked bar chart that shows the number of casual riders to annual members.
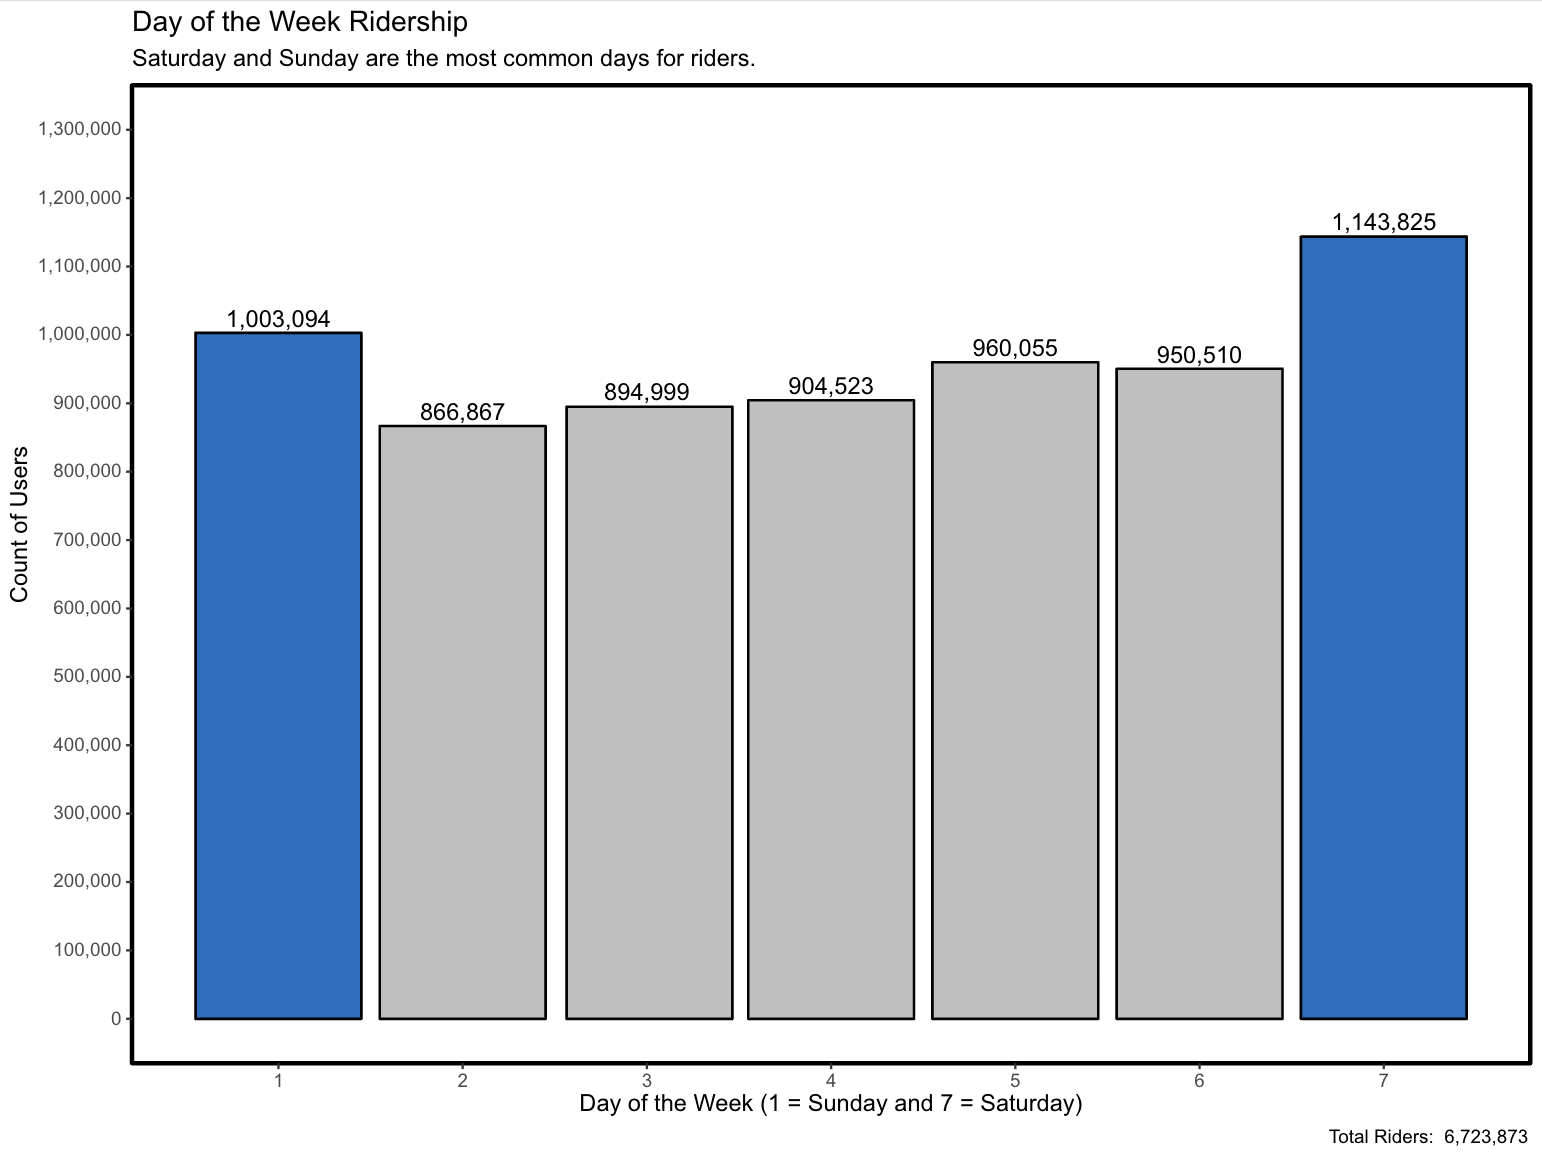
- day_of_week_ride_bar is a bar chart that shows the distribution of riders by day of the week where 1 = Sunday and 7 = Saturday.
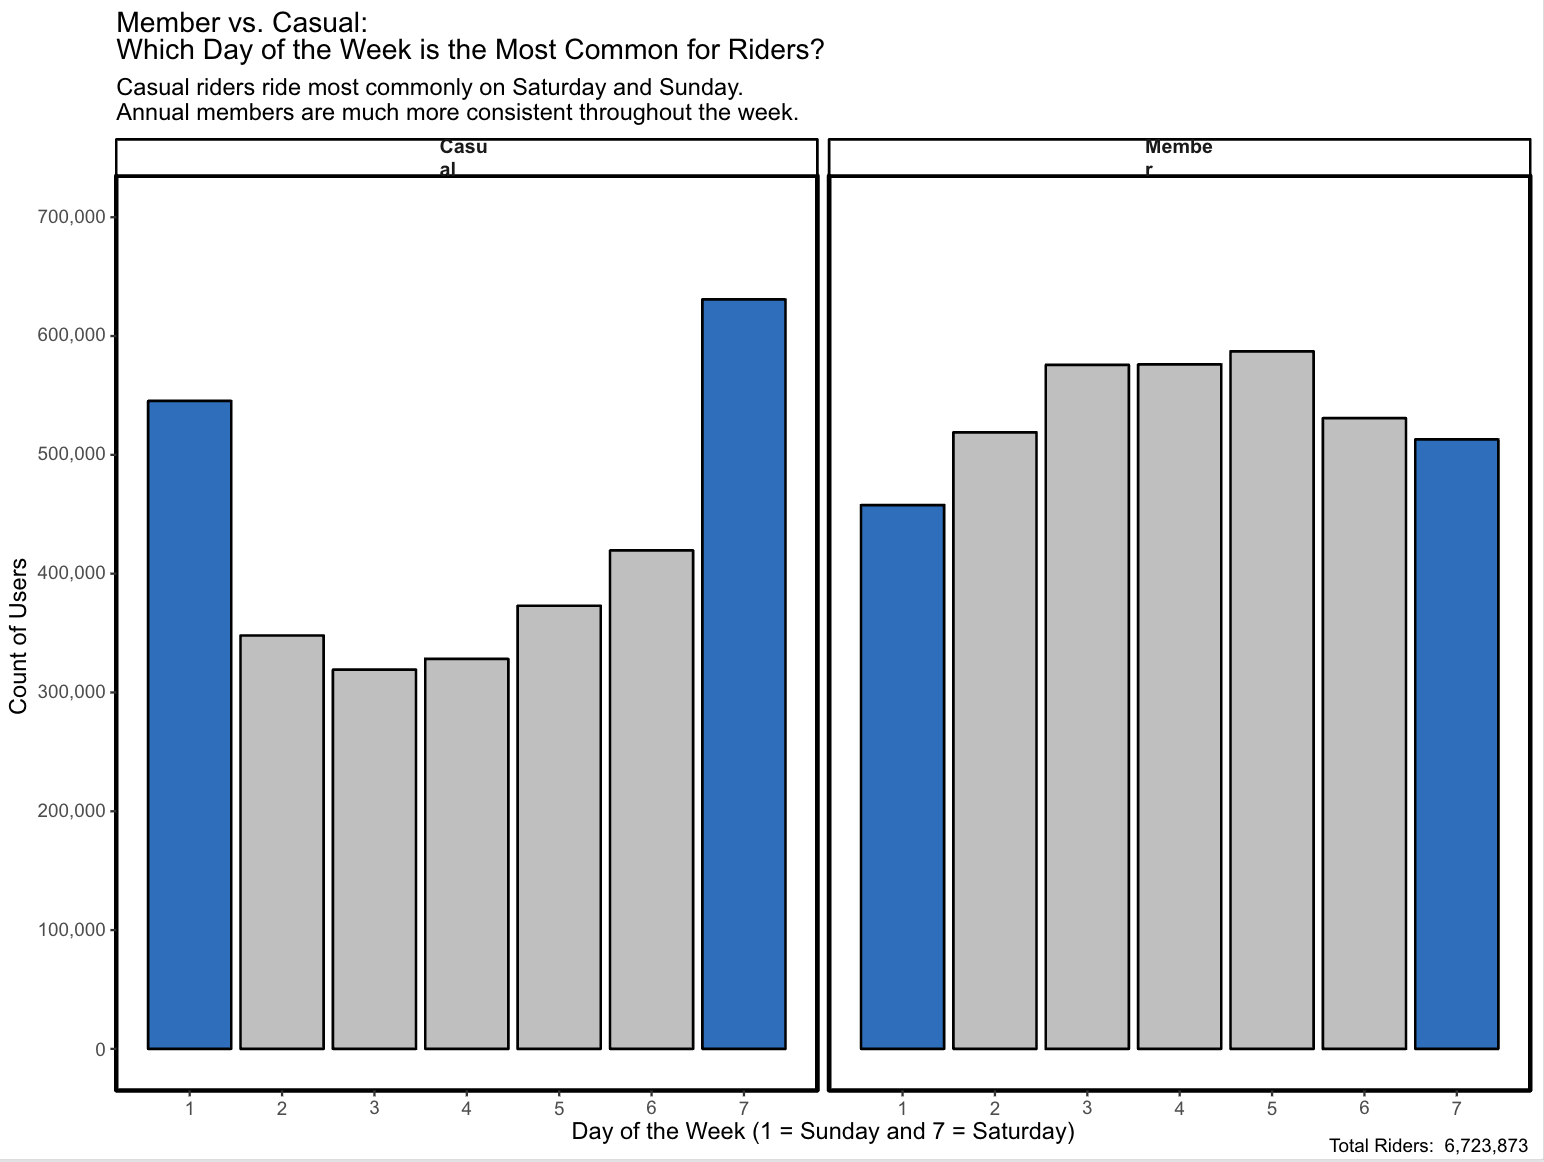
- day_of_week_ride_bar_grouped are bar charts that show the distribution of riders by day of the week grouped by annual members and casual riders.
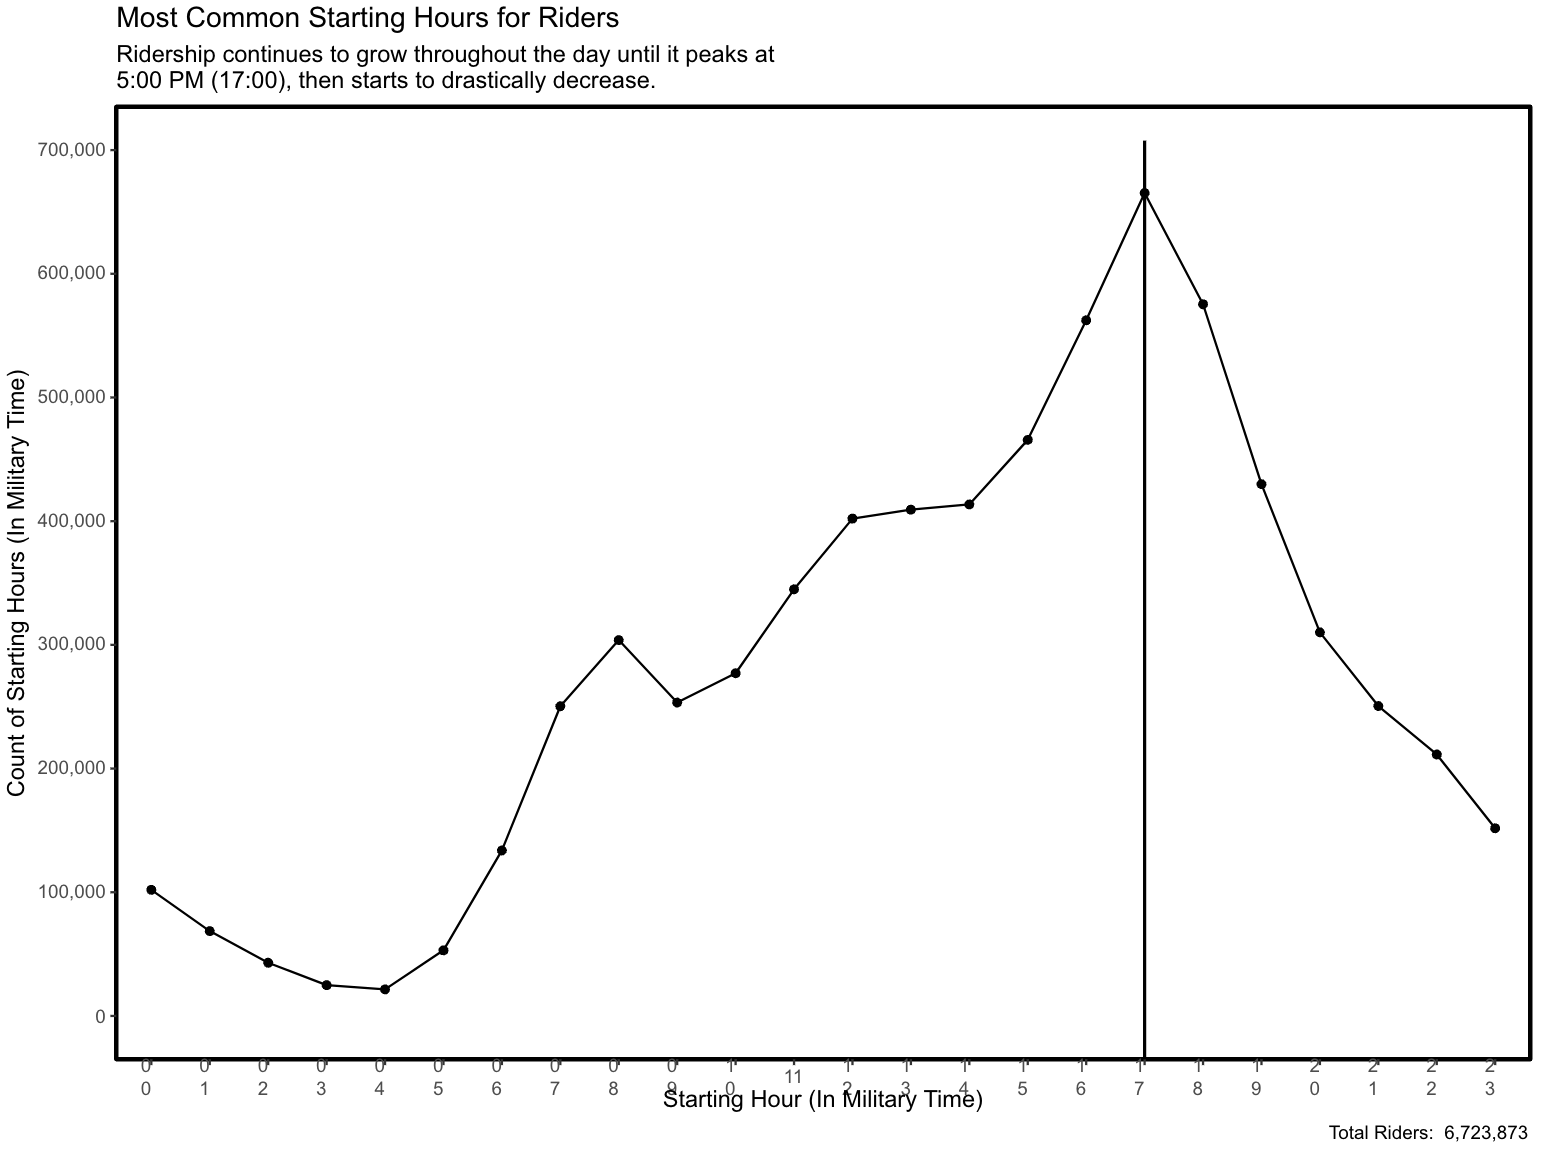
- all_riders_starting_hours_count is a line chart that shows what hour (in military time) does ridership start.
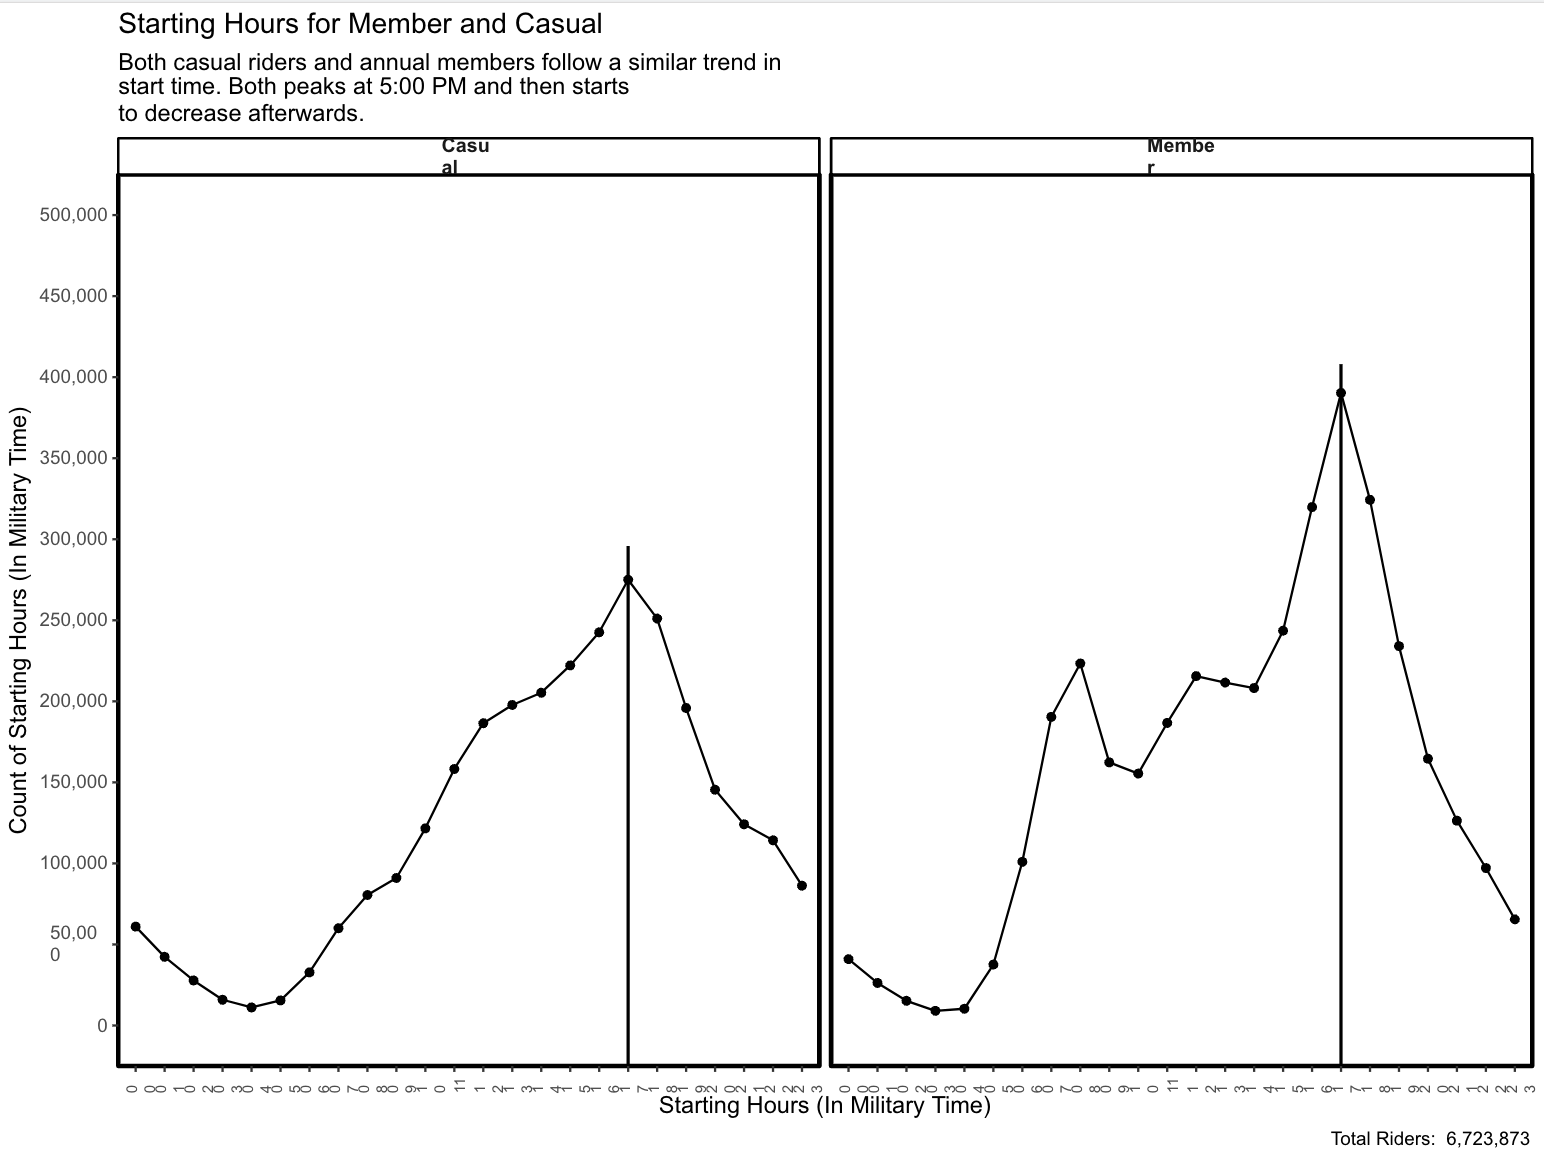
- member_casual_start_hour_grouped_chart are line charts that show what hour (in military time) does ridership start grouped by annual members and casual riders.
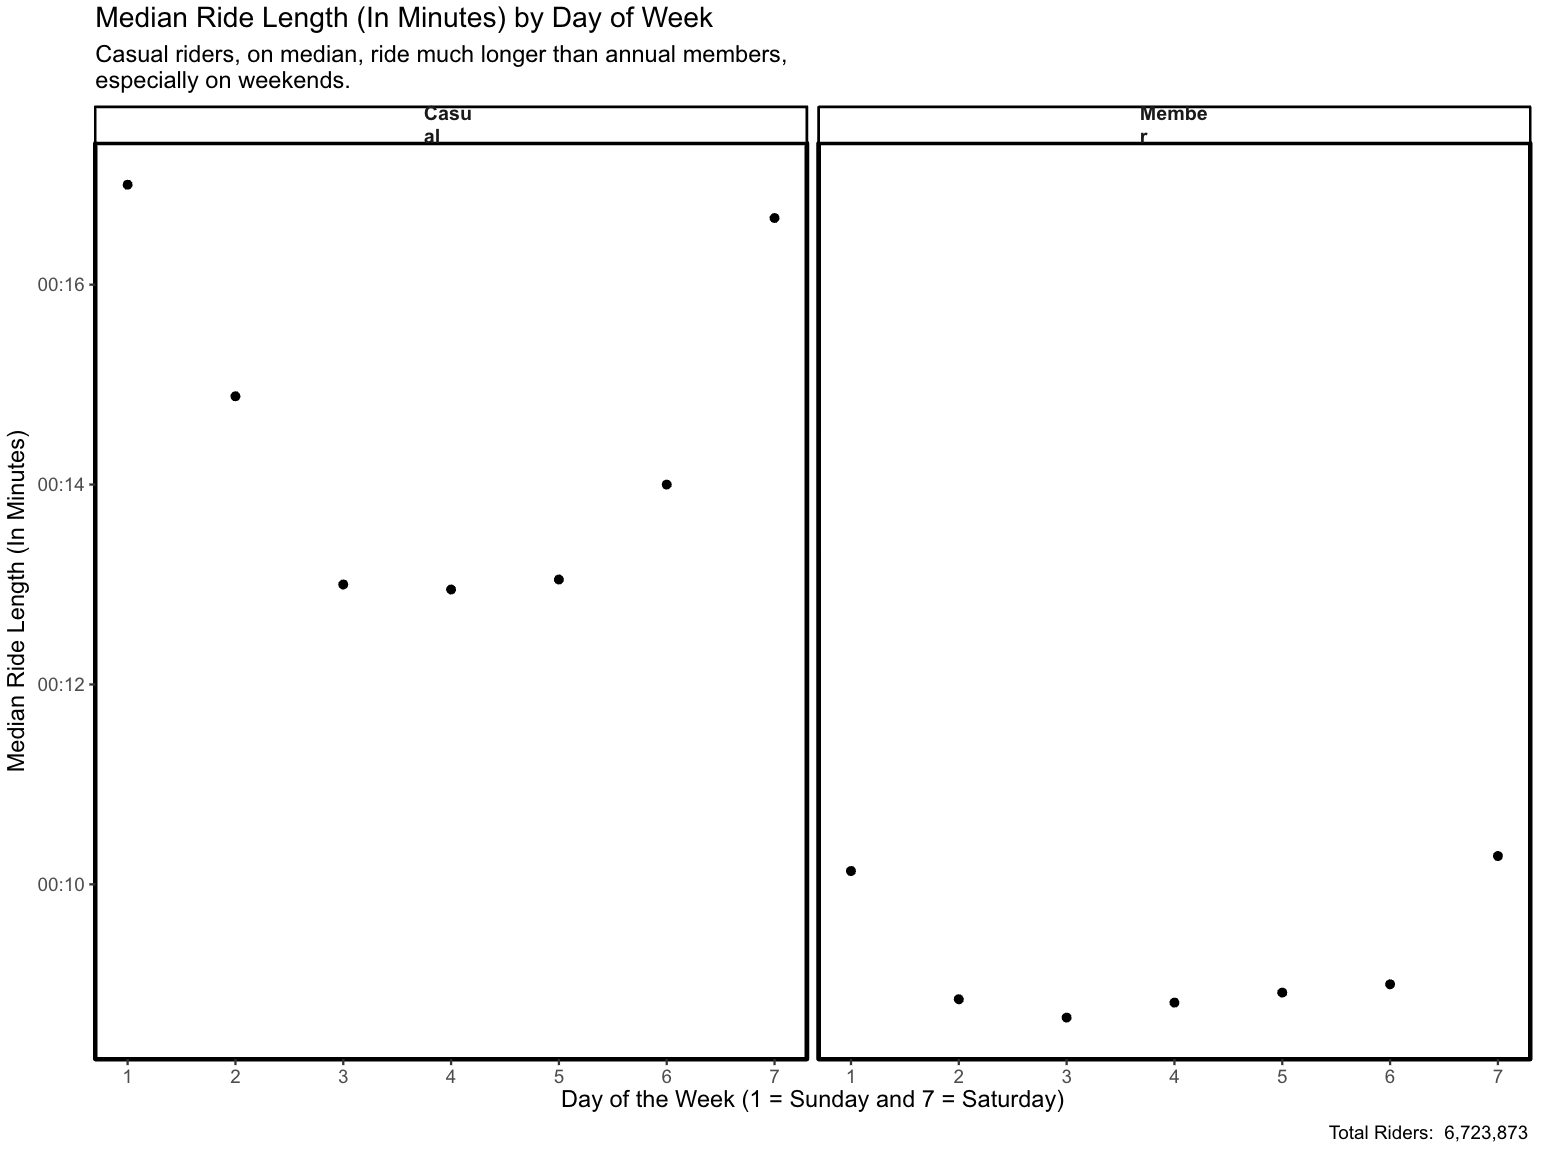
- day_of_week_ride_length_var are scatter plots that show the median ride length (in minutes) for each day of the week grouped by annual members and casual riders.
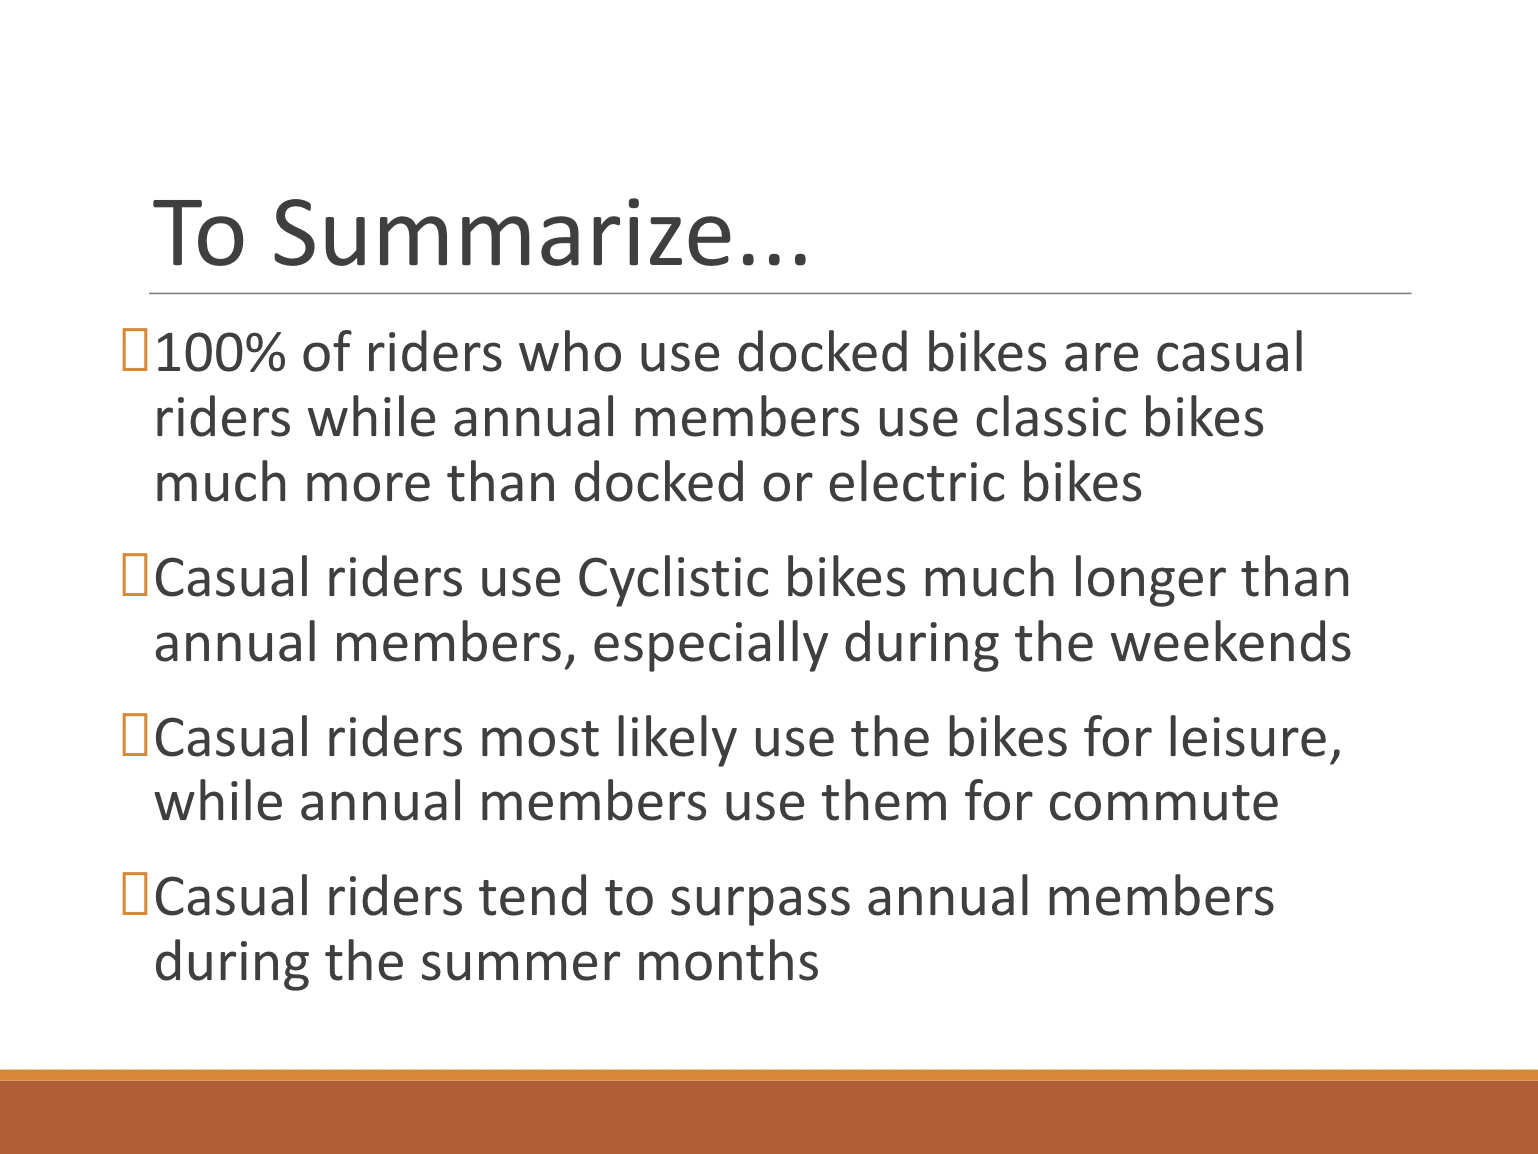
- No annual members use docked bikes, but 100% of casual riders use them. Classic bikes are the most popular option for rideable types, especially amongst annual members. Why do only casual riders use docked bikes? Probably because docked bikes allow the riders to lock their bikes up throughout the day. Works well with full day passes.
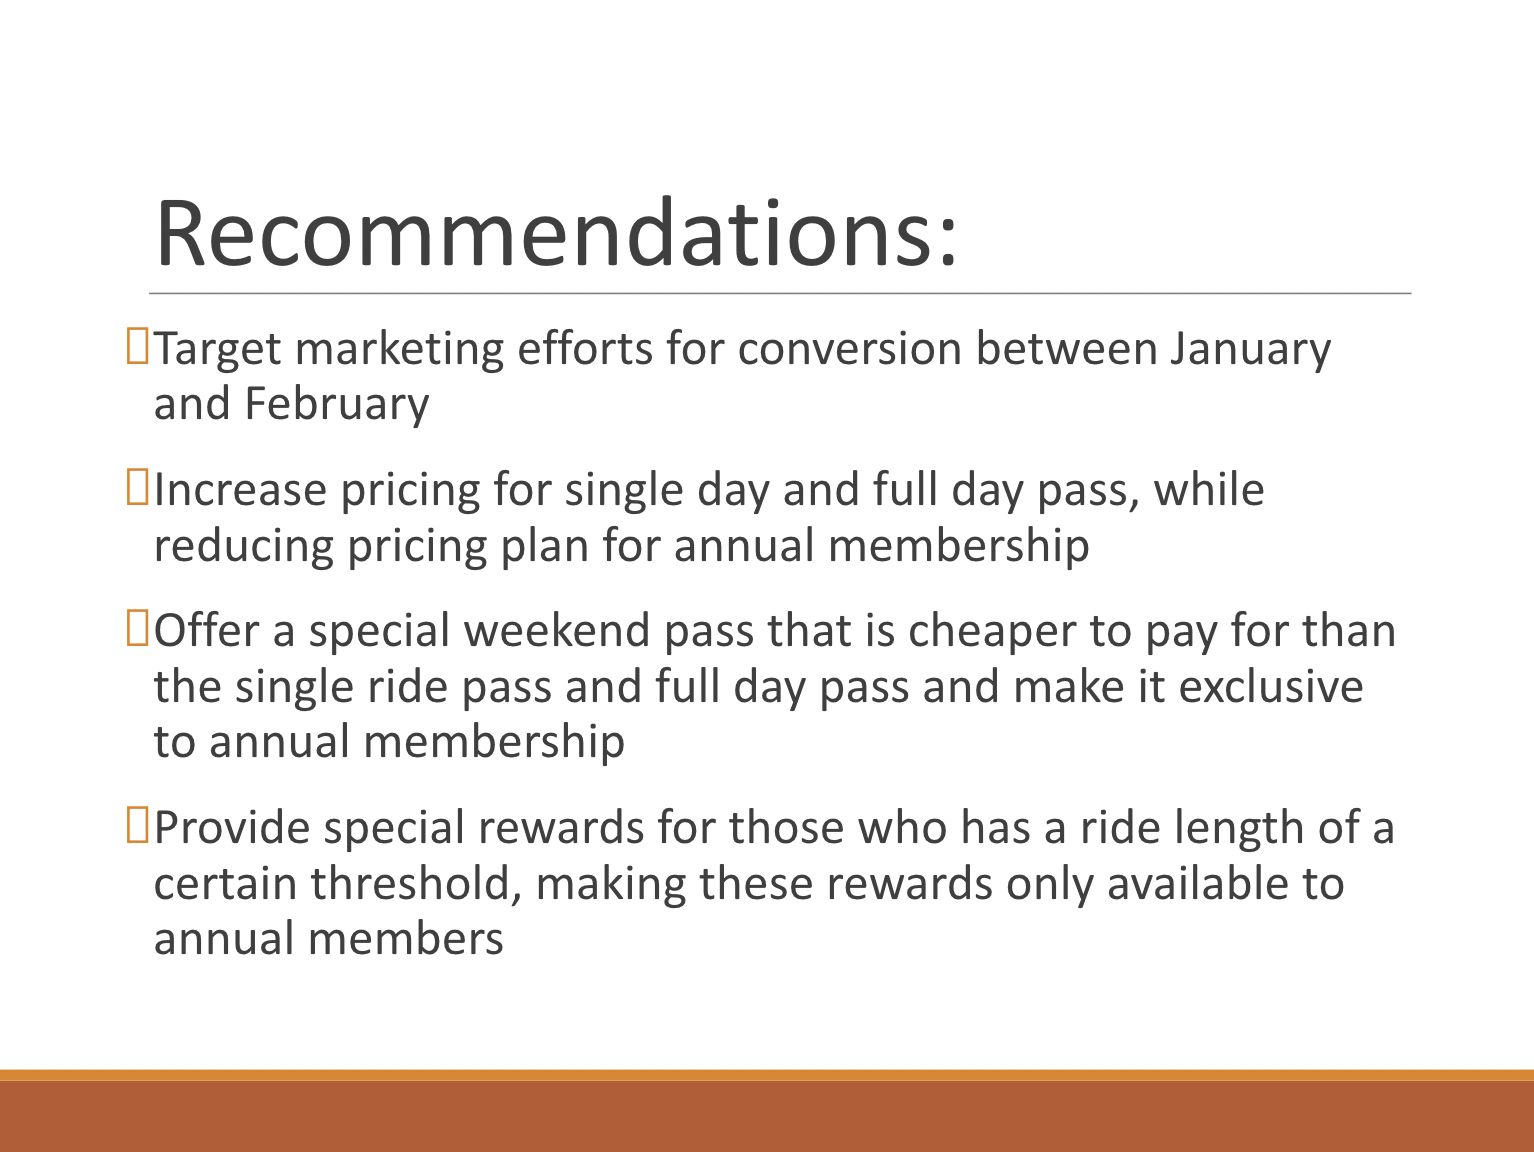
- Most popular months for riders are May, June, July, and August. Casual riders tend to surpass annual members during the months of July and August. Why does this trend happen? These four months are probably the best months to ride bikes for leisurely activities. The lowest number of riders occur between December and February, where the average 10 year (2010 to 2019) temperature for Chicago is between 17 and 37 degrees fahrenheit. The average 10 year (2010 to 2019) temperature for Chicago during the months of May, June, July, and August is between 51 and 83 degrees fahrenheit. Campaign / marketing efforts to convert casual riders to annual members should take place between January and February, giving enough time for casual riders to see the benefits of annual memberships when summer comes.
- Most common rides occur during Saturdays and Sundays. When breaking the data down, casual riders use bikes much more frequently during Saturday and Sunday, while the opposite is true for annual members. Annual members' ridership is much more uniform throughout the weekdays, with Saturdays and Sundays being the least frequent days for rides. For casual riders, the weekdays are much less frequent with rides being heavily skewed towards the weekends. Why are weekends much more common for casual riders, while the opposite is true for annual members? This could indicate that annual members use their rides for commutes during the weekdays more frequently than their casual counterparts. This also provides more supporting reasoning that casual riders use Cyclistic’s bikes for leisurely activities.
- When looking at start hours for riders, we see that ridership grows from 4:00 AM until it peaks at 5:00 PM. After 5:00 PM, ridership drastically decreases. This coincides with how the normal working schedule works for many people, e.g. you start working at 9:00 AM and end at 5:00 PM, which is when ridership peaks. If you break down the chart by casual riders and annual members, the same trend follows with ridership peaking at 5:00 PM.
- When looking at median ride length for casual riders and annual members, casual riders use Cyclistic bikes much longer than annual members, especially during the weekends.